It goes without saying that to improve OEE performance, your team first needs the most up-to-date information on their current performance to enable them to make the appropriate decisions to improve productivity. Real-time information enhances productivity and creates a true visual management in factory – from the shop floor to the top floor.
Tackling an OEE improvement project? Not sure where to start?
Here are 8 applications that are proven to improve your Overall Equipment Effectiveness with minimal investment:
| Initiative |
Issue |
Strategy | Solution |
| Visually Display KPIs | “We would like to display our KPIs but have not defined all of them yet and also don’t know how best to display them so that everyone is made aware.” | Expose KPIs just as soon as they are defined and provide this information to the people most likely to affect changes that enhance manufacturing performance. Display KPIs as deemed necessary to support change. |
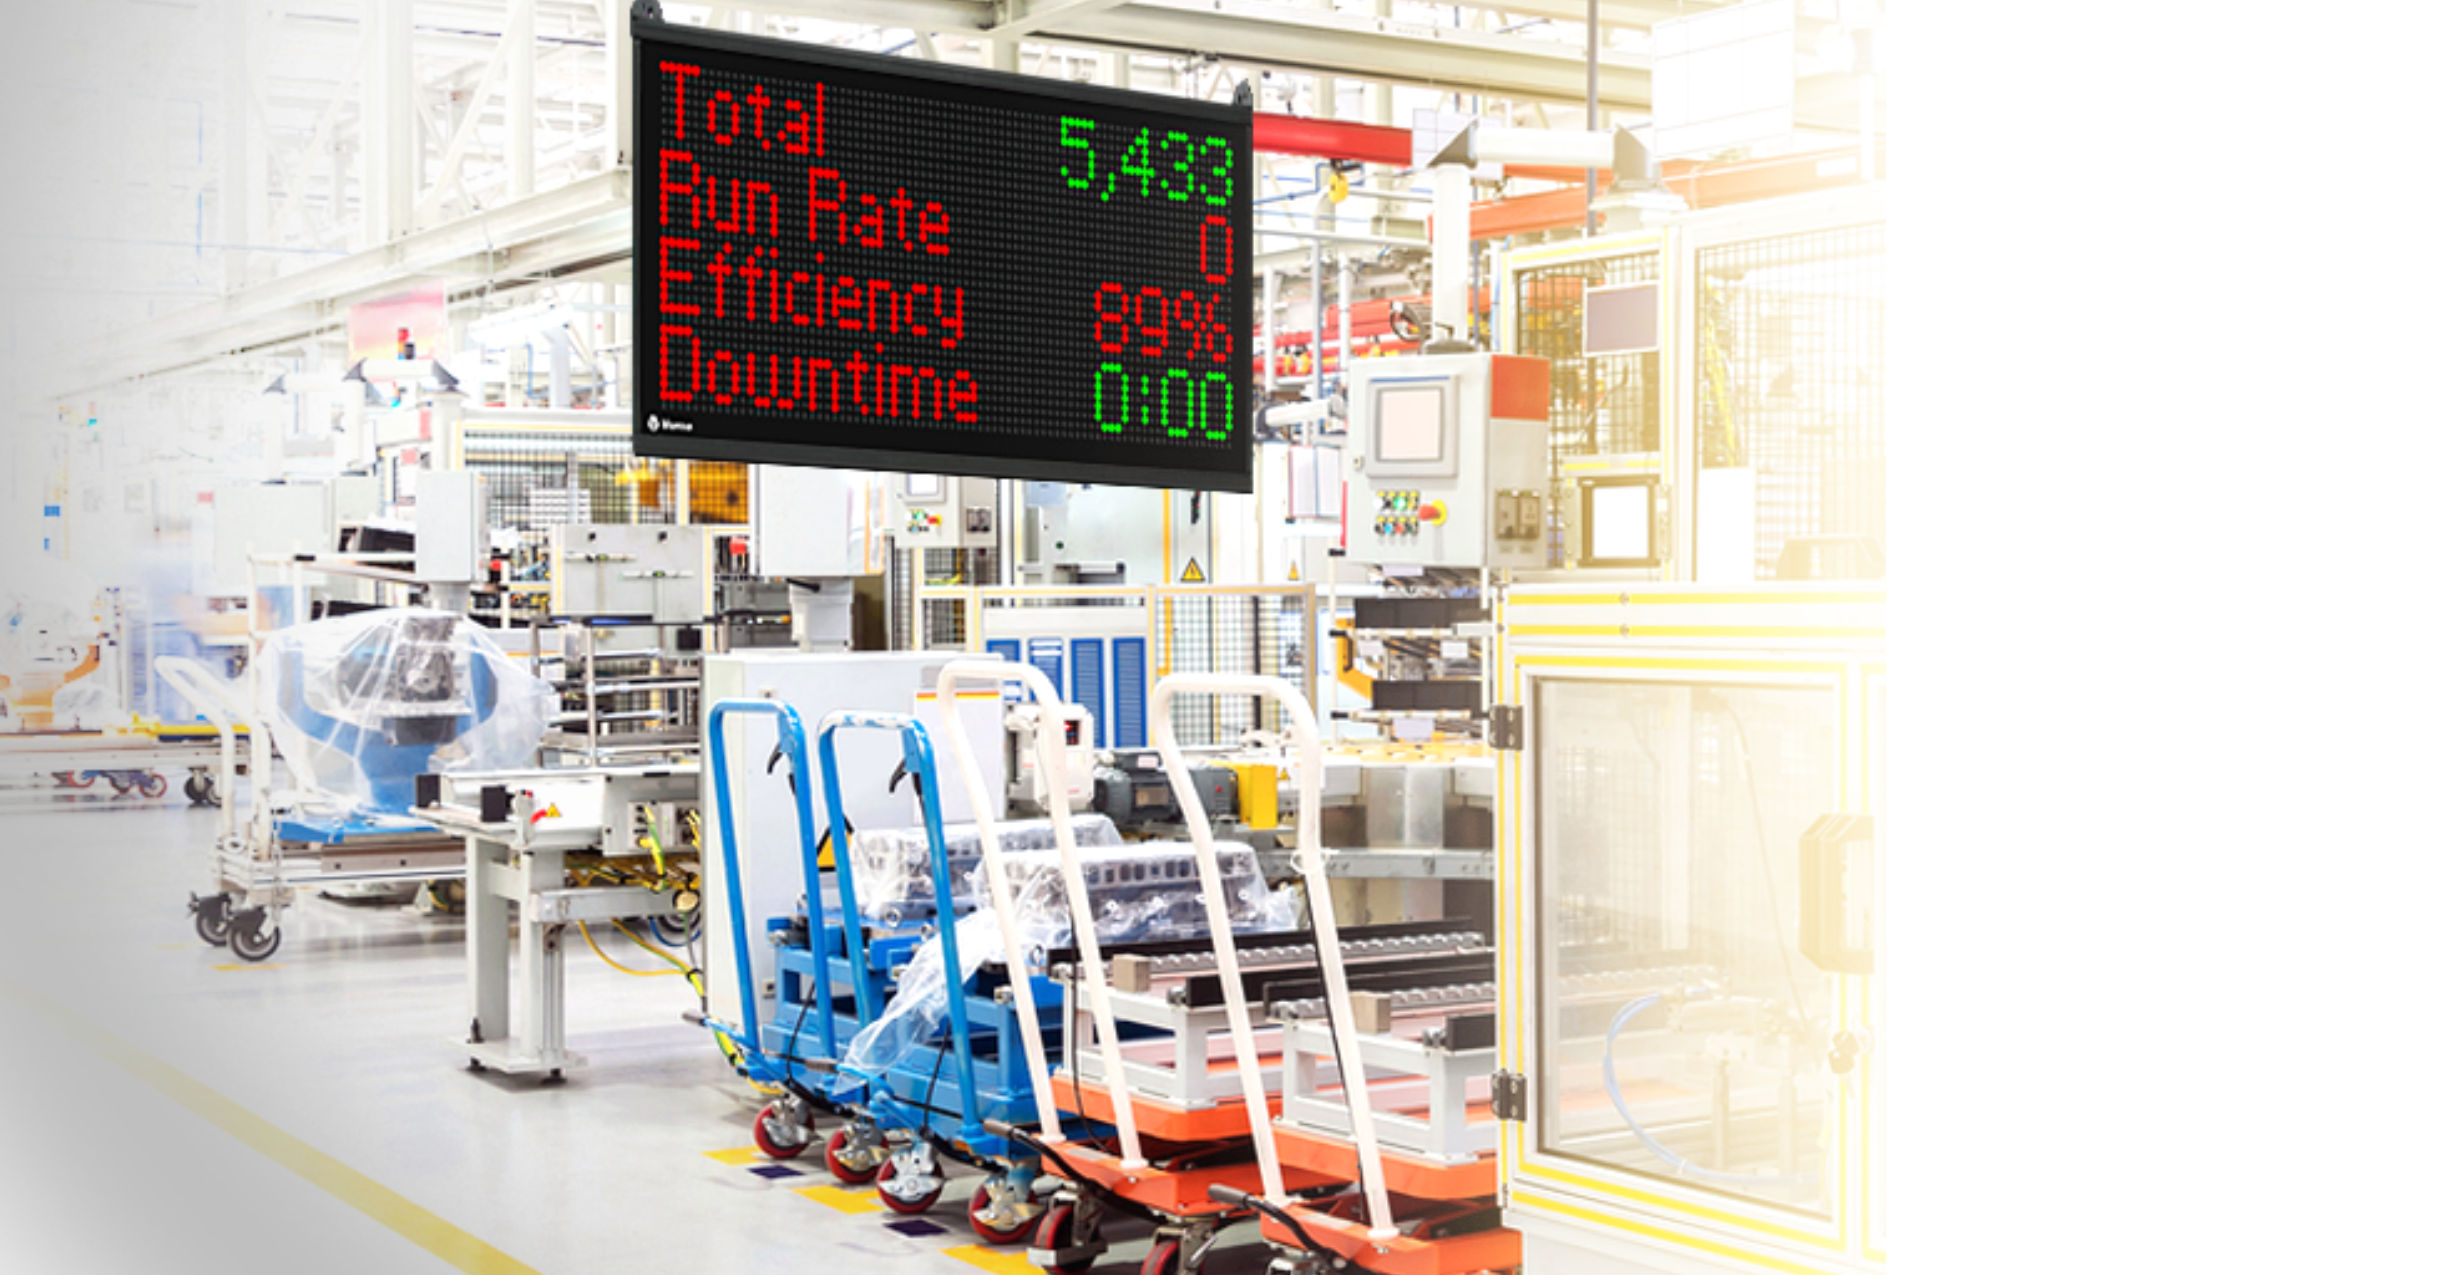
Set-up a shop floor scoreboard that can be reprogrammed at any time. Some productivity appliances like the XL Platform have a built-in connection and can push this information over your network. This enables real-time production data via a simple web browser! |
| Real-time OEE Display | “Our company has identified OEE as a great tool to enhance manufacturing performance. Our problem is implementing it.” | A visual display provides critical real-time OEE data to everyone involved from the plant floor to the boardroom. | Display your OEE visually to all levels of the informational hierarchy. With just a couple sensors, the ideal cycle time and a time schedule you can collect and display real time OEE on your plant floor and over your network. |
| Availability, Performance, Quality Percentage Display |
“We want to focus on one specific OEE factor at a time but want the flexibility to display other variables in the future.” |
Display last event and/or total accumulated downtime. Other focused displays can provide target count/actual count data, real-time run rate and much more. | Some production monitors can show any combination of over 100 production focused process variables. Consider pushing this information over your network to enable access at both management and operator levels. |
| Reduce Quality Waste | “Quality loss is affecting our customer satisfaction.” | Display good, reject and total pieces. Additionally, show the percentage good part yield. | Set-up your shop floor visualization and scoreboard to display good, reject and total pieces, percent efficiency, OEE quality and more. Use short interval control meetings to drive improvement of these KPS across all roles and responsibilities. |
| Reduce Cycle Time Waste | “Performance loss costs us capacity, on-time delivery and ultimately profitability.” | Display the current cycle, last completed cycle, average cycle time, small stops, reduced speed cycles and/or OEE performance metrics in real-time and in any combination. | Display cycle time metrics and more including average cycle time, OEE performance, number of events and cumulative time for small stops and reduced speed cycles to help pinpoint performance loss and recover capacity. |
| Reduce Downtime Waste | “Downtime loss remains an issue and is a significant contributor to waste in our manufacturing process.” | Start by exposing downtime. Real-time display of downtime in downtime system creates a sense of urgency that is not felt in a report seen a day or week later. | Display last event and total accumulated downtime as well as the number of events and the average event downtime in addition to OEE availability. This keeps downtime as top of mind. |
| Event / Accumulated/ Average Changeover Timer | “We perform several changeovers throughout a shift and lose track of our progress.” | Record and display last event and total accumulated changeover time. Additionally, the total number of events and an average changeover time can be displayed. | Display last event and total accumulated changeover time as well as the number of events and the average changeover time to really fuel SMED and quick changeover programs. |
Ready to tackle these proven applications and start improving your Overall Equipment Effectiveness with minimal investment?
The XL platform and our dedicated OEE software are a simple entry point for OEE improvement applications such as these. The XL productivity appliance uses I/O to communicate with your process and includes a scoreboard for your operators with built-in reporting for your managers.
Check out our 90-Day Free Trial Offer to get started.

