Ever consider how much time your teams currently spend manually collecting and calculating data?
It may be difficult to conceive depending on the size of operation you are accustomed to but even today, many sites operate with an ad-hoc system for data – particularly organisation and reporting.
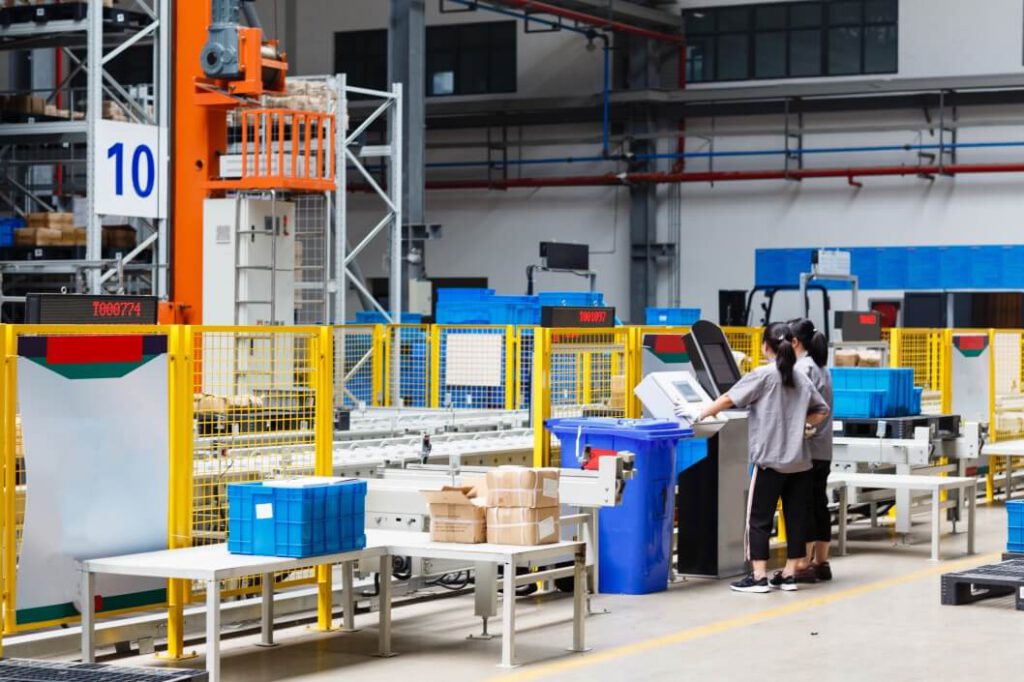
Those that manually collect data are spending 4-5 hours of front-line manager time adding up data, entering it into spreadsheets, and bringing it to meetings in which whole teams sit round and discuss the data, and set actions based on what they interpret.
Despite this huge investment in time, not one site we have visited has told us that their manual data collection is accurate.
Replacing manual processes and data gathering with automated data collection and digitized processes is the first step to becoming a data-driven organization and culture.

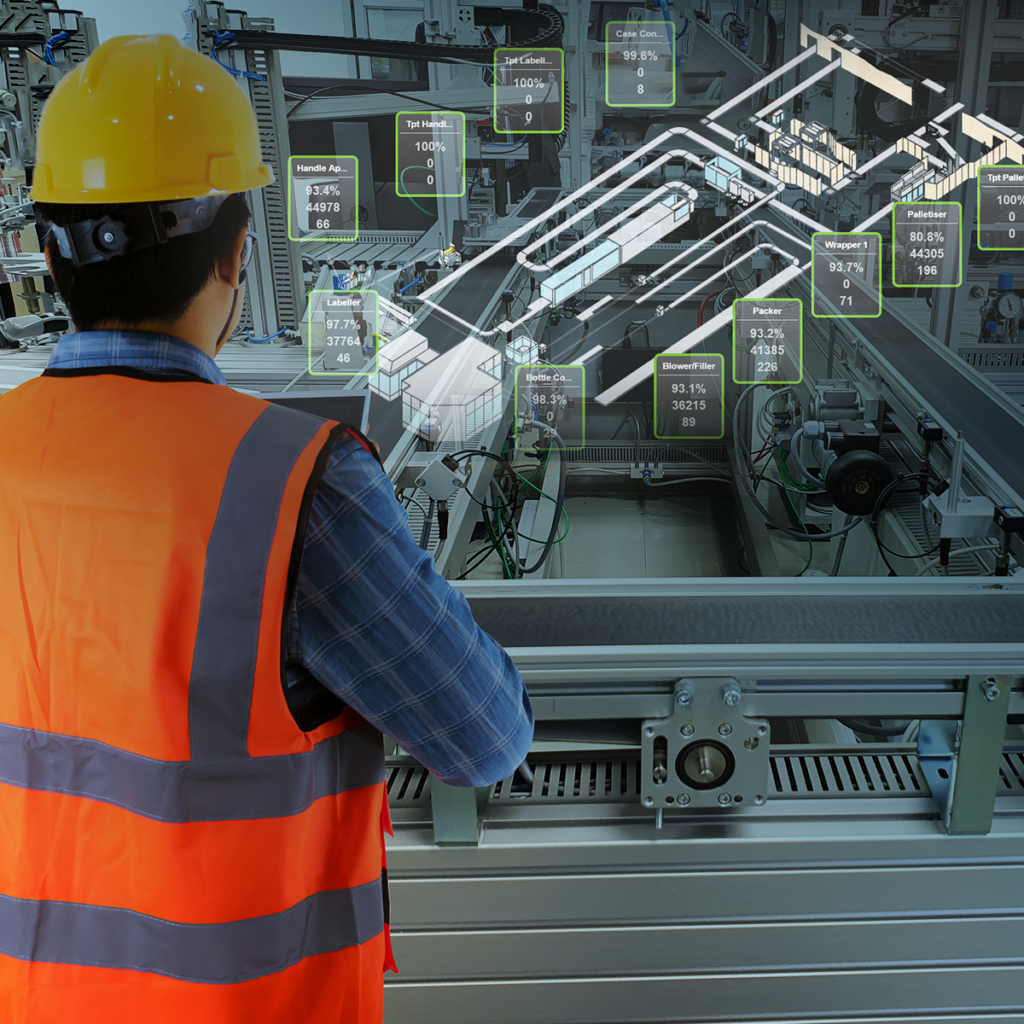
Shop floor visualisation is a great starting point, with minimal CapEx investment:
Many sites first experience factory-floor visual management through the Andon systems typically found in the Toyota Production system.
With a minimal investment, a visual factory software allows operations to ‘take the first step’ on the ladder to a smart factory approach.
Our recommendation for such visualisation is the XL Productivity Appliance by Vorne.
This type of system has much of the same functionality of a traditional Andon system with additional reporting functionality and user-configuration.
“See the information you want. Exactly the way you want to see it. XL provides instant access to your production data. And it’s incredibly easy to access that information. View it in XL. Export it to Excel,” explains the Vorne website.
Use visual management to understand:
- If your current Takt time is below target
- When your actual speed is below target
- OEE measures
- How you’ve lost output on the job/shift
- When to do quality checks
- Count down for breaks or changeovers
When linked to other devices, it’s even possible to:
- Activate a horn to sound at the end of break time.
- Activate a light system to indicate when a particular machine has gone down on a busy factory floor
- Trigger a buzzer when it’s time to do a quality check
- Activate an alarm when speed or Takt time dips below a minimum number
Ready to implement shop floor visualization?
Look for a complete bolt-on solution that provides real-time, accurate downtime tracking and shop floor visualisation. In addition to real-time visibility, it is extremely helpful to access historical analysis to aid decision-making.
Of course, a more robust production line monitoring system is the ultimate intelligence for high-speed production lines, but on the path to a smart factory, lower-level functions within the operations can greatly benefit:
- Eliminate manual data capture
- Plant floor scoreboard
- Accurate, automated downtime analysis